Curious about how users and trails interact within a network? With hybrid user monitoring, we collect and visualize usage data across different trail segments and user groups. This allows us to identify hotspots and usage patterns — supporting targeted resource allocation for coexistence, maintenance, and trail management.
The use
Visual analysis
Control of user behavior
Validation of steering concepts
Validation of Signage, Routes & Infrastructure
Diagnosis of density zones
Target group analysis
How does it work?
Before getting started, it’s important to define what exactly you want to know. Are you looking to understand user behavior or evaluate trail usage patterns? Do you need a proof of concept — or are you aiming for actionable recommendations? Where are the hotspots for hikers and mountain bikers?
If budget or time is limited, point-based measurements from counting stations can offer basic data — such as how many hikers or bikers pass a given location. However, they won’t show what happens beyond the station: Does the biker turn into a protected area? Which path does the hiker choose at the next junction?
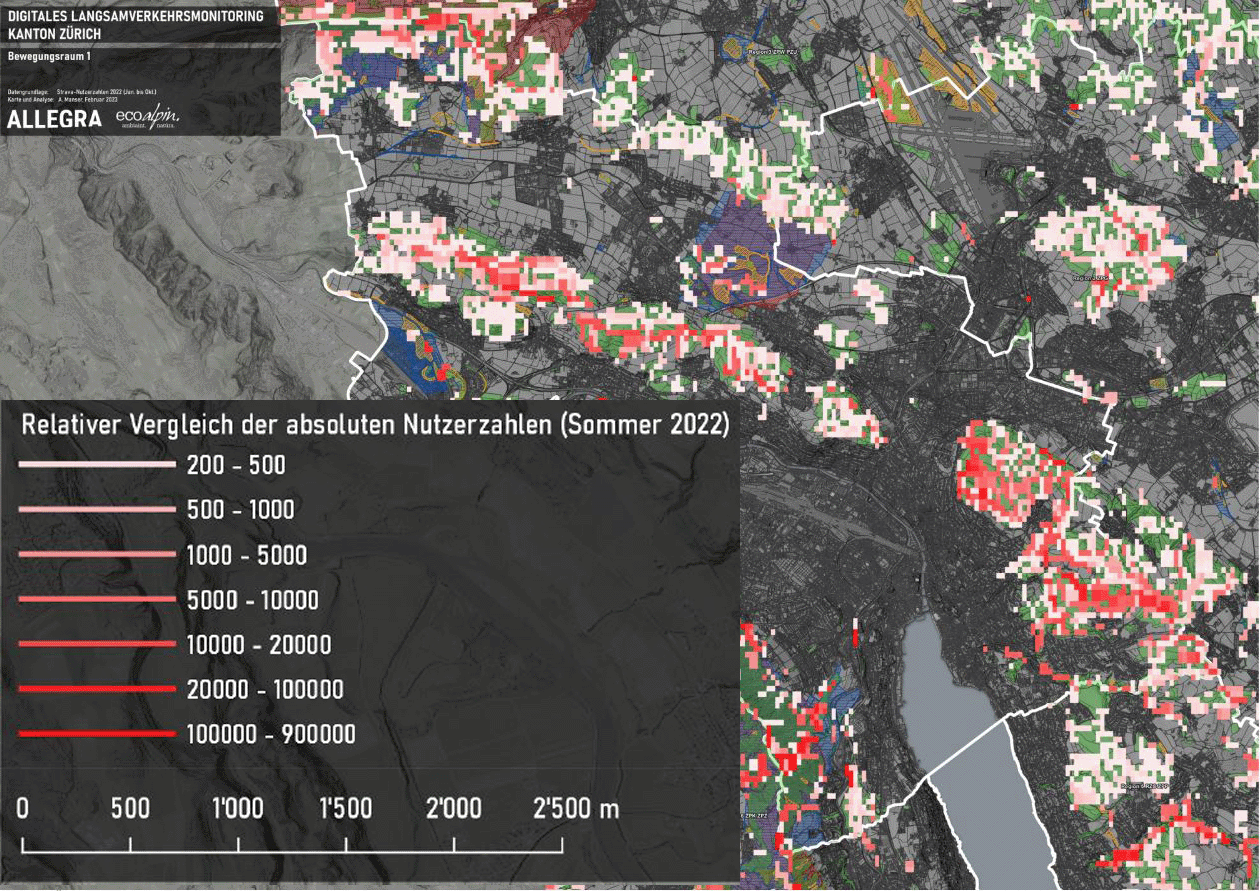
User Monitoring
User Monitoring goes further. It combines counting station data with movement data visualized via heat maps — derived from digital apps. The longer the monitoring period, the more accurate and meaningful the insights become.
Sounds exciting? We think so too! Write to us if you want to find out more.
Please tell us more about your situation. From development to planning, construction and knowledge transfer, we at ALLEGRA are there for you in all phases.